Welcome to MyView
Customize your stock dashboard with drag-and-drop cards, resizable layouts, and real-time graphs.
See My View in Action
Drag & Drop
Rearrange stock cards effortlessly to suit your workflow.
Resizable Cards
Adjust the size of each card to focus on what matters most.
Interactive Graphs
Visualize Max Pain and PCR data directly within each card.
MyView Dashboard Walkthrough
A step-by-step guide to help you build your first dashboard using MyView.
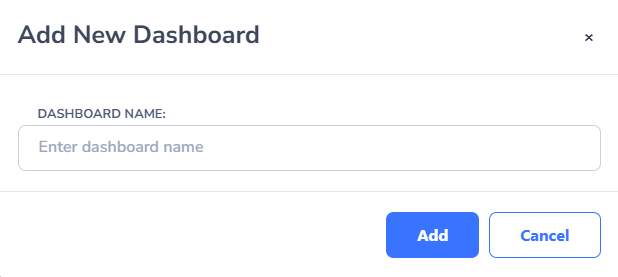
1. Create a Dashboard
Click on "Get Started" to add a new dashboard by entering a name.
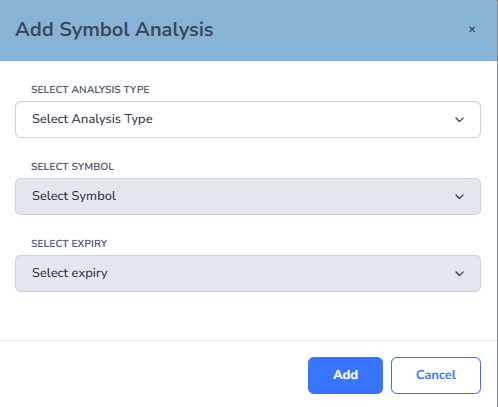
2. Add a Stock for Analysis
Select your analysis type, stocks, and expiry date to proceed.
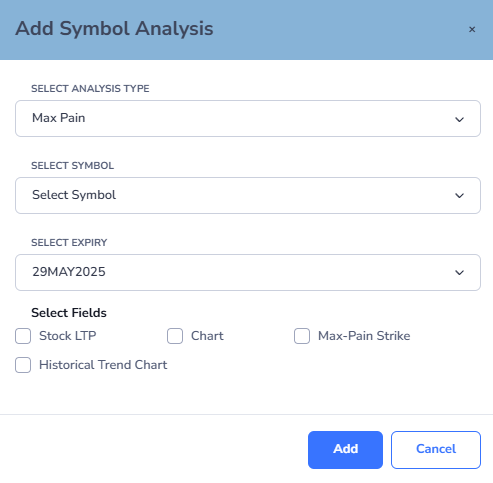
3. Choose Fields to Display
Customize which data you want to visualize—LTP, charts, trends, etc.
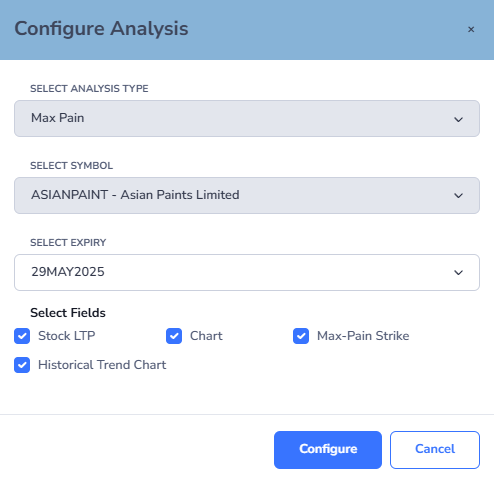
4. Configure Analysis
Review and configure your selected analysis before adding it to the dashboard.
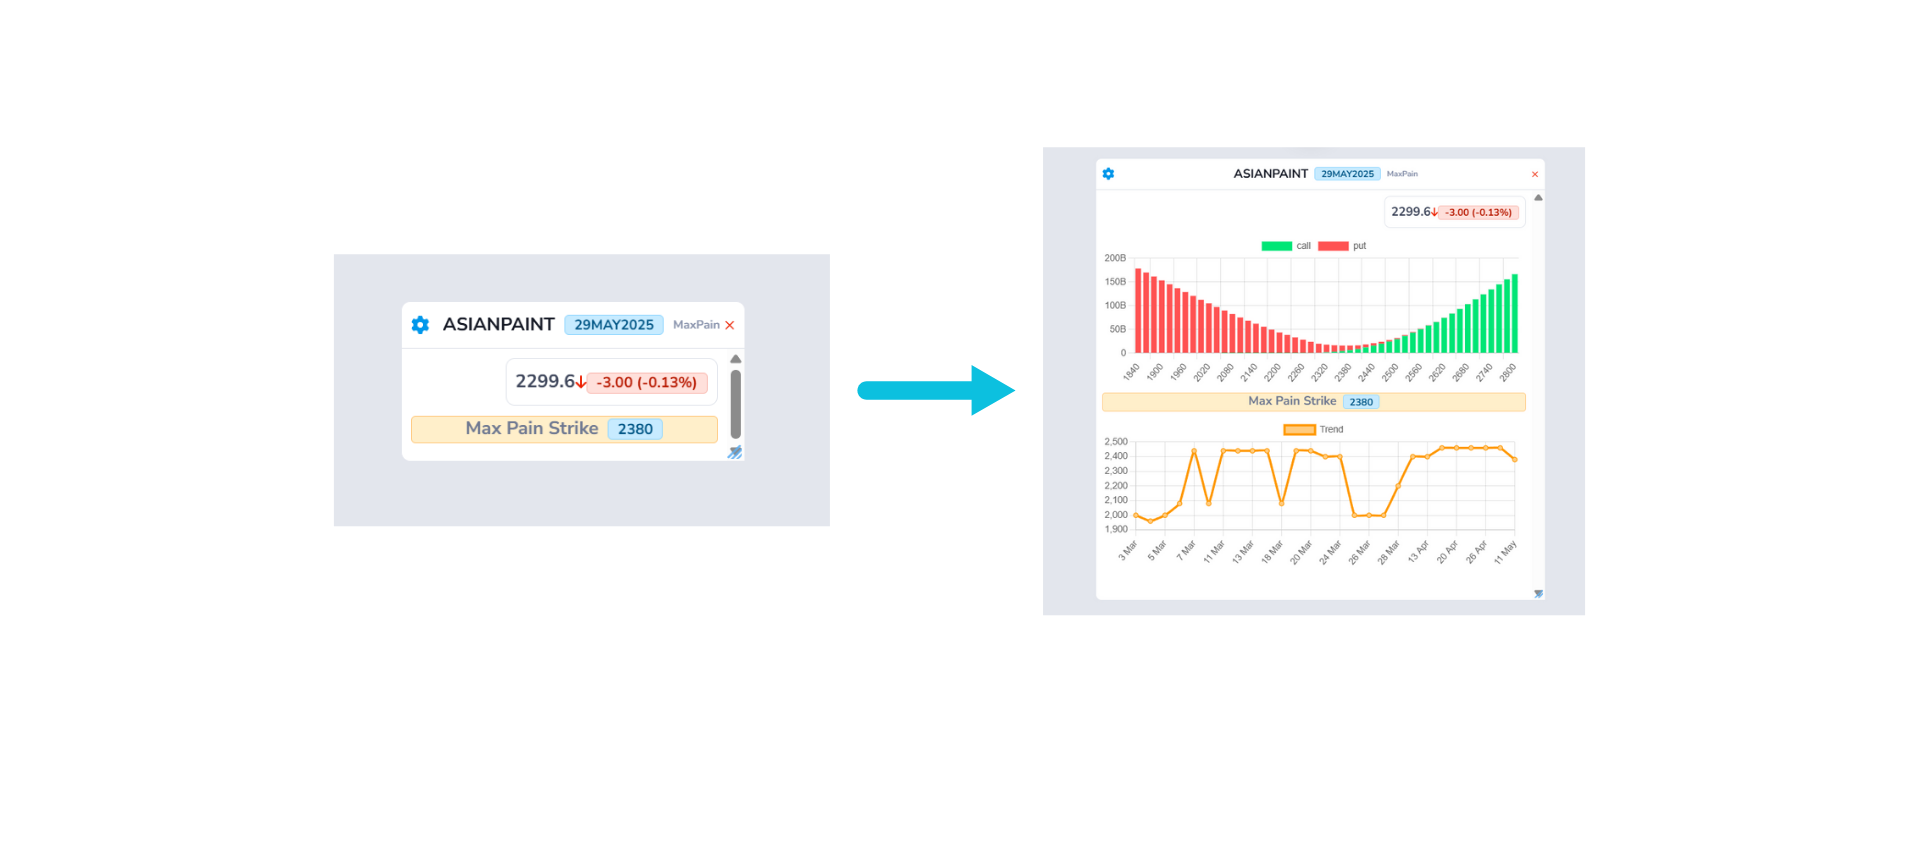
5. Resize your cards
Resize any card to focus more on the data that matters to you.
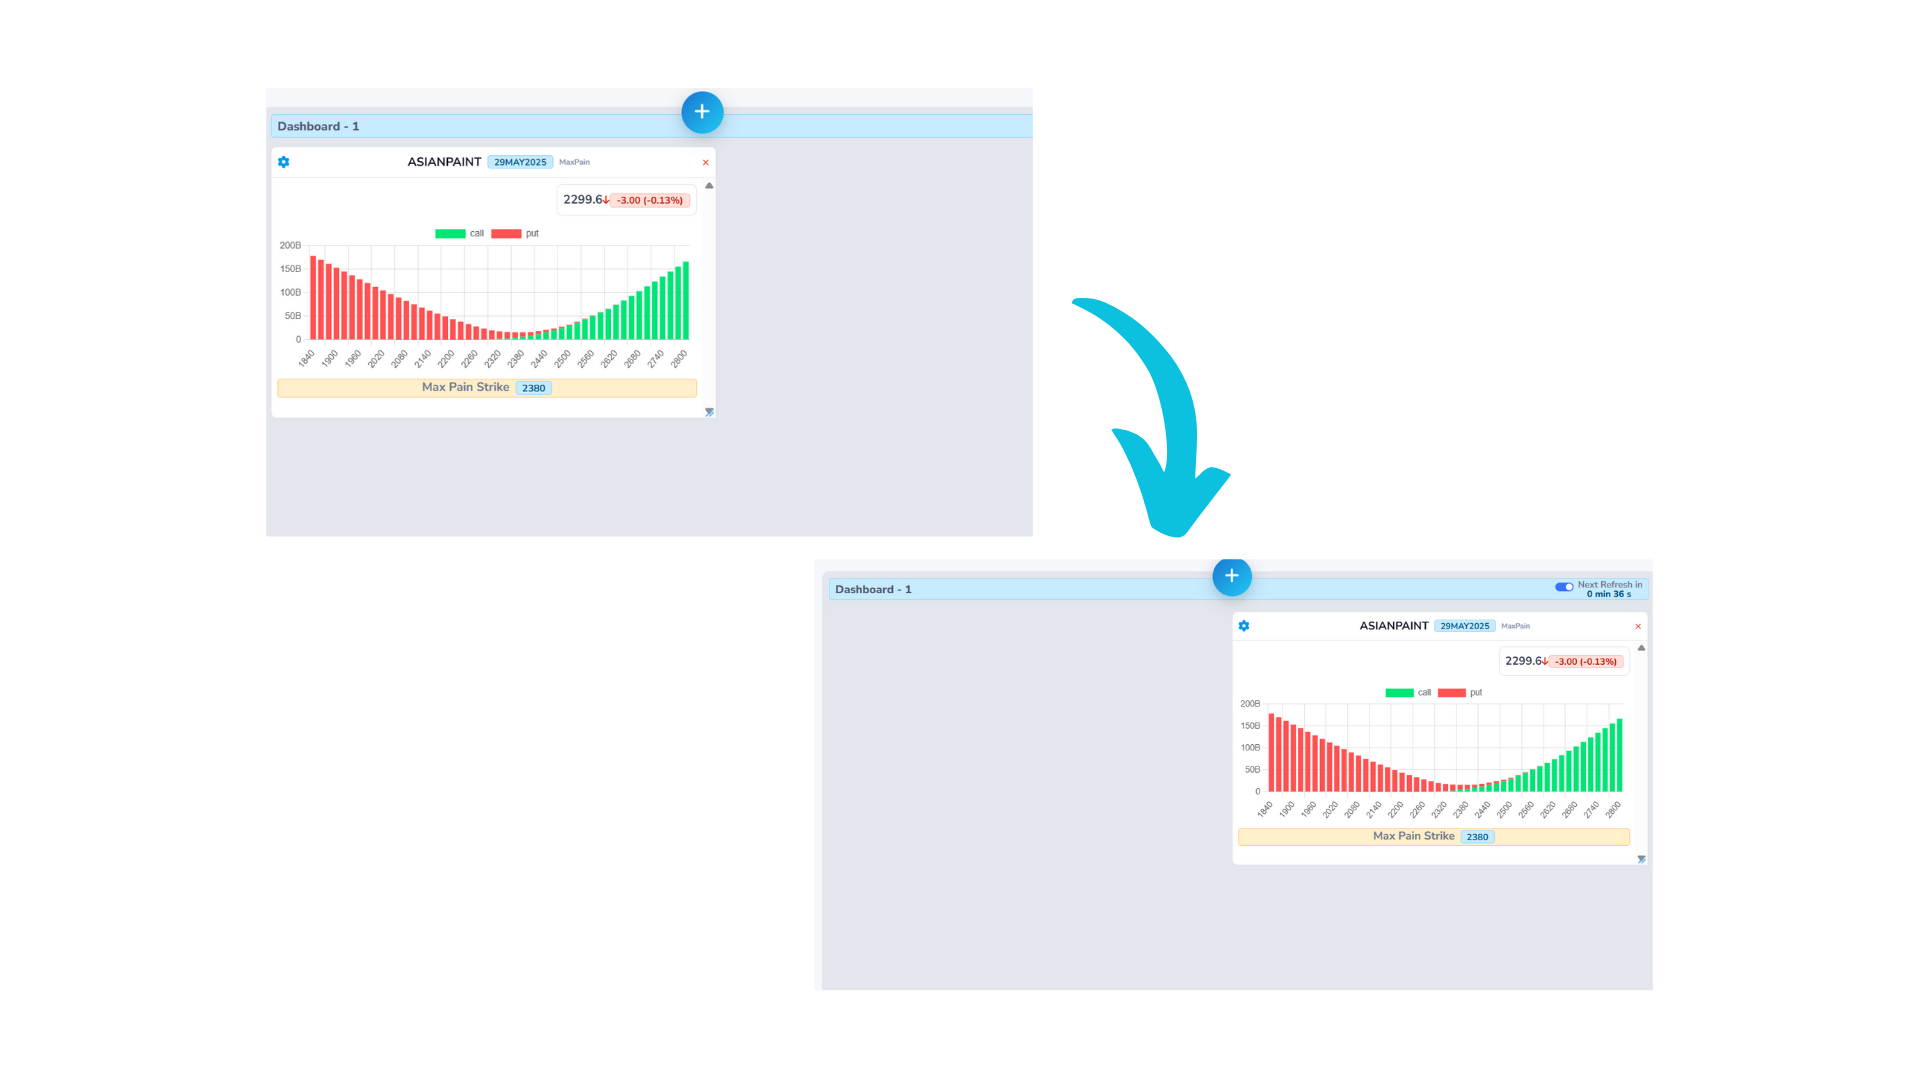
6. Drag and Drop
Effortlessly rearrange dashboard cards using simple drag-and-drop functionality.
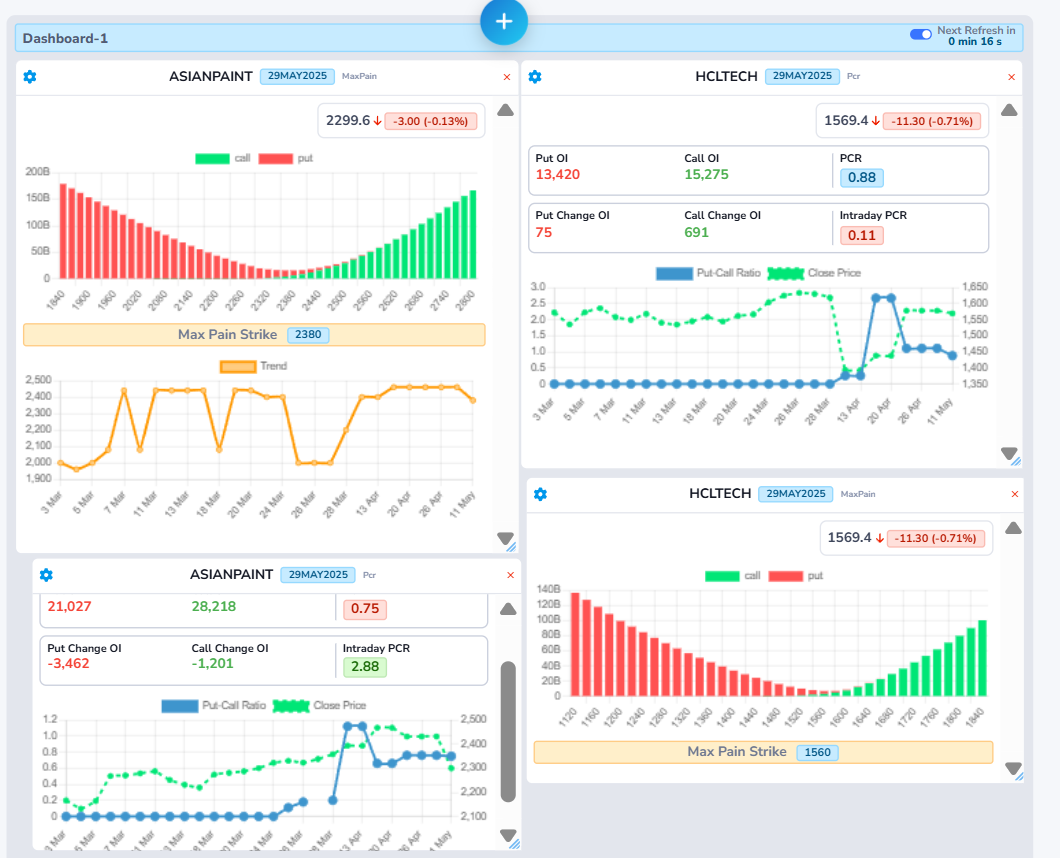
7. Explore Your Dashboard
Interact with real-time graphs and analytics. Rearrange or resize cards as needed!

